Chapter 6: ERP Analysis with ERPLAB
Continuing from Chapter 5 — Events and Epoching.
This is where ERPLAB's own menu takes over from EEGLAB's — everything from here on is about turning epochs into averaged waveforms and, ultimately, a table of measured values.
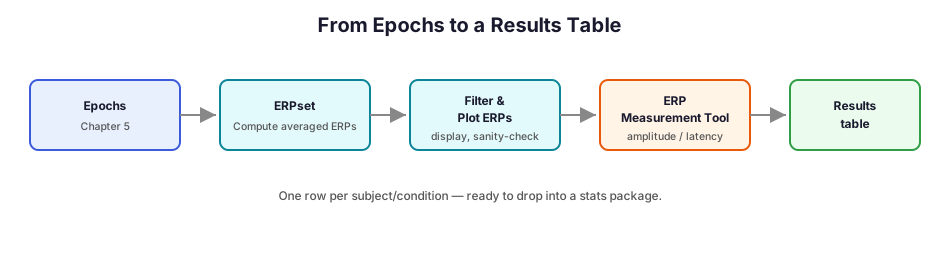
From epochs to an ERPset
With epochs extracted (Chapter 5) and organized by condition, ERPLAB → Compute averaged ERPs averages all epochs of the same condition together, producing an ERPset — ERPLAB's structure for a set of condition-averaged waveforms, one per channel. An ERPset is the direct counterpart to MNE-Python's Evoked object: same underlying operation (averaging repeated trials to cancel noise and reveal the shared response), different tool.
ERP-specific filtering
EEGLAB's general filter (Chapter 3) works fine before epoching, but ERPLAB also has its own Filter & Frequency Tools, tuned for use on already-averaged ERP waveforms — useful when you want to smooth a final averaged waveform for display without re-filtering the entire continuous recording.
The ERP Measurement Tool
This is ERPLAB's headline feature. Rather than eyeballing a peak on a plot, ERPLAB → ERP Measurement Tool extracts quantitative values automatically, across as many subjects, conditions, and channels as you point it at, in one pass:
- Pick a measurement type — peak amplitude, mean amplitude over a window, peak latency, area, or a few others.
- Define the time window and channel(s) to measure in (e.g. 250–450 ms at Pz for a P300).
- Point it at a folder of ERPset files, and it exports a plain results table — one row per subject/condition — ready to drop straight into a stats package.
For a study built around a named component (P300, N400, MMN, ...), this tool is usually the fastest path from cleaned data to a table of numbers you can run statistics on.
Plotting
ERPLAB → Plot ERPs overlays condition waveforms on the same axes (channel-by-channel or as a full scalp array), and can also draw a scalp topography at a single chosen time point — the two most common figures in an ERP paper.
Beyond a single subject
Once each subject has their own ERPset, group-level statistics typically move outside ERPLAB itself — into EEGLAB's STUDY tools for statistical testing on scalp data, or by exporting the Measurement Tool's table into R, SPSS, or Python for standard repeated-measures analysis. ERPLAB's job ends at "reliable numbers per subject and condition"; what test you run on those numbers is a separate decision.